CORROSION MANAGEMENT SOFTWARE
SMARTCORR® Corrosion and Erosion Management System (SCEMS)
Corrosion management software connects to a network of sensors inside pipes, tanks and other vessels. An erosion and corrosion monitoring system measures the thicknesses of this infrastructure and alerts operators to metal loss that could lead to failures and costly downtime. Because oil and gas companies operate in highly corrosive environments, they need to prepared for conditions that will impact their equipment and infrastructure on a regular basis. Corroded components can lead to irreparable damage to valuable equipment, cause unexpected delays in production and create a hazardous environment for workers. This is why it is critical that companies within the oil and gas sector keep a close eye on corrosion.
Corrosion analysis software provides a number of advantages to users. First and foremost, it reduces the need for constant inspections, especially in hard-to-reach or inaccessible areas. By warning users of higher-than-expected levels of corrosion, monitoring software also makes it possible to replace components before they fail as part of regular maintenance. By keeping inspectors from having to access potentially dangerous areas, corrosion software also helps maintain a safer workplace. Operators can make better-informed decisions about the care of their systems.
SMARTCORR® corrosion management software is a highly integrated and intelligent system. It covers multiple monitoring process parameters, such as process flow, pressure, temperature, the temperature in the cabinet, corrosion data, alarm, temperature, etc.
Monitoring the corrosion is undertaken by a combination of the following methods:
- Electrical Resistance (ER) probes.
- Weight Loss Coupons.
- UT Wall Thickness Measurement.
- Chemical sampling and analysis.
- Cathodic Protection。
All the above methods give a direct or indirect indication of the condition of the process equipment and the corrosivity of the contained medium. The data and outcome or results of the different monitoring activities are to be combined in the software and analyzed according to users’ needs.
As an example, SMARTCORR® On-line Corrosion Probe System Consists of Access Fitting, Adapter, Transmitter, Cable, Junction Box, Intelligent Unit, Corrosion Management server and SCEMS software. The probe data is achieved in a user-defined interval and stored in SCEMS. The user can monitor the corrosion data in real time and make corresponding analysis by the SCEMS software.
SCEMS Features
This section is a description of the SMARTCORR® Corrosion and Erosion Management System (SCEMS) and the most common components within SCEMS. This also explains general techniques on how to effectively manage all your data and streamline the processes and information that are vital to your asset’s reliability, efficiency, and profitability.
SCEMS can apply widely across the board in many different industries, such as Utilities, Communication, Field Service, and the Retail sector.
- Single User Desktop
- On Server
- Creating and Configuring a New Database
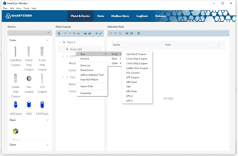
1.1 Building the Plant Model
1.2 The Selection Tool
1.3 Properties Tool
1.4 Configuring Measuring Points
1.5 Process Diagrams
- Data Entry
2.1 Data Workbook Filter Options
2.2 Logbook
2.3 Coupon Corrosion Calculator
The Coupon Corrosion Calculator performs the task of calculating corrosion rates based on several parameters of an exposed coupon. This value is calculated automatically when all the necessary parameters have been entered, and the calculated value is then stored to the database.
Input Parameters:
- Coupon Dimensions: Enter the area of the coupon being used and the density of the material from which the coupon is made.
- Weight Loss: Enter the weight loss directly or the start and end weight. With the latter case, the Weight Loss field will be filled out automatically when both values have been entered.
- Exposure Time: Enter the exposure time or the start date and the end date. In the latter case, the Exposure Time field will be filled out automatically when both dates have been entered.
- Calculated Corrosion Rate: The Corrosion Rate field will be filled out automatically when all required fields have been completed. The Time tag field must be filled out before the data can be stored to the database. The corrosion rate can be displayed in either mm/y or MPY by selecting the appropriate radio button.
- Report Packages:
SCEMS Reports are powered by Crystal Reports. The format of these reports allows them to be exported to Word, RTF, HTML or PDF. Points can either be sent to a report by highlighting a system, container or point in the Plant layout, or by selecting a group of points in the Selection Tool.
3.1 Current Status Report
3.2 Points in Alarm Report
3.3 Configuration Report
3.4 Log Report
3.5 Calculated Parameter Report
3.6 Statistical Report
3.7 Detail Report
3.8 Point History Report
3.9 System Status Report
- Data Analysis Using Graphs
4.1 Producing a Single Graph
4.2 Multiple Plot
4.3 Overlay Plot
4.4 Correlation Graph
4.5 Comparison Plots
4.6 Live Time Graph
4.7 Various charts for analysis Bar Chart/ Area Chart/ Ribbon Chart/ Pie Charts
Corrosion Prediction Tool
CO2 and H2S corrosion (termed “acid gas corrosion”) in oil and gas production environments are key contributors to asset degradation and failure. Accurate quantification of corrosion and erosion is critical in order to enable improved assurance of the safe utilization of steels across almost every production unit in oil and gas production and transmission.
Corrosion prediction is a module in SCEMS, which takes an integrated, comprehensive perspective to intelligently assess system corrosivity. SCEMS also facilitates prediction of corrosion and erosion rates for carbon steels in production/transmission environments containing CO2 and/or H2S. Based on decades of joint Industry Program research and industry utilization data, Predict captures the effects of key critical environmental and operating parameters that influence corrosivity. It further characterizes the effects of these parameters on corrosion rates, utilizing extensive laboratory data, phase behavior models and fluid dynamic characterization.
Prediction module provides a practical prediction of system corrosivity for carbon steel based on available operational parameters such as:
- Application or process data (e.g, pressure, temperature, gas oil and water flow rates)
- Speciation data (e.g, acid gas concentration and water analyses)
- Project data (e.g., service life, corrosion allowance, well or stream information)
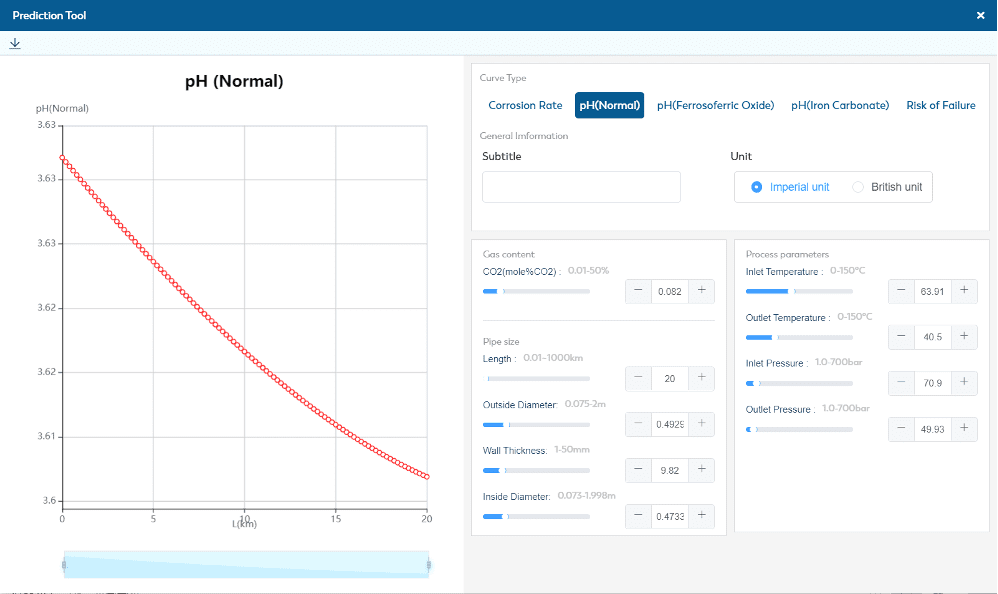
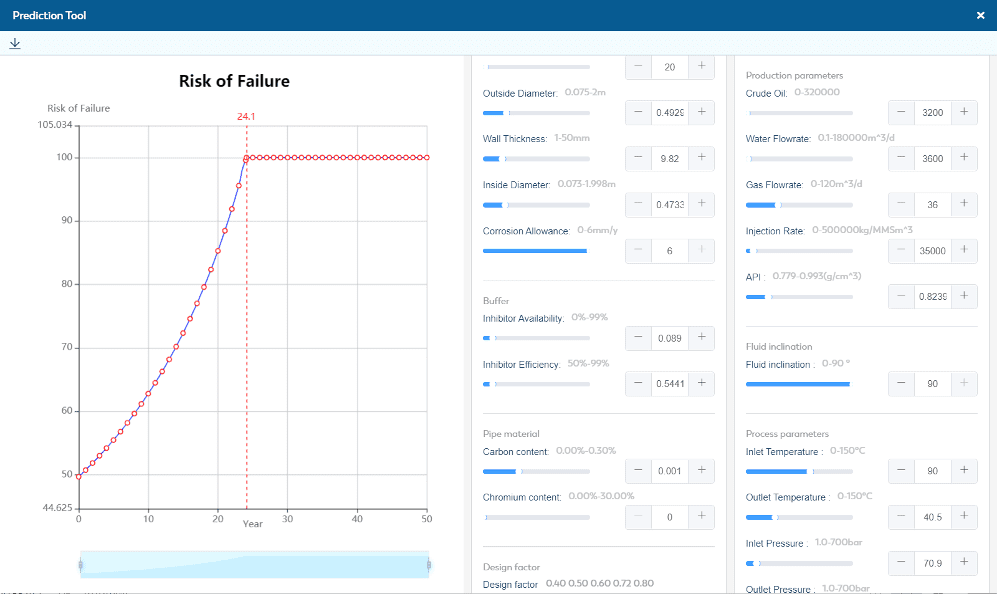
Once the input data is entered, there are usually three ways to output the forecast data:
- Corrosion rate prediction (expressed in mpy or mmpy)
- Risk of failure prediction
- pH value prediction
The prediction accuracy depends on the accuracy of the input process data, speciation data and project data, etc. A report is to be generated accordingly.
Oil and Gas pipelines.