



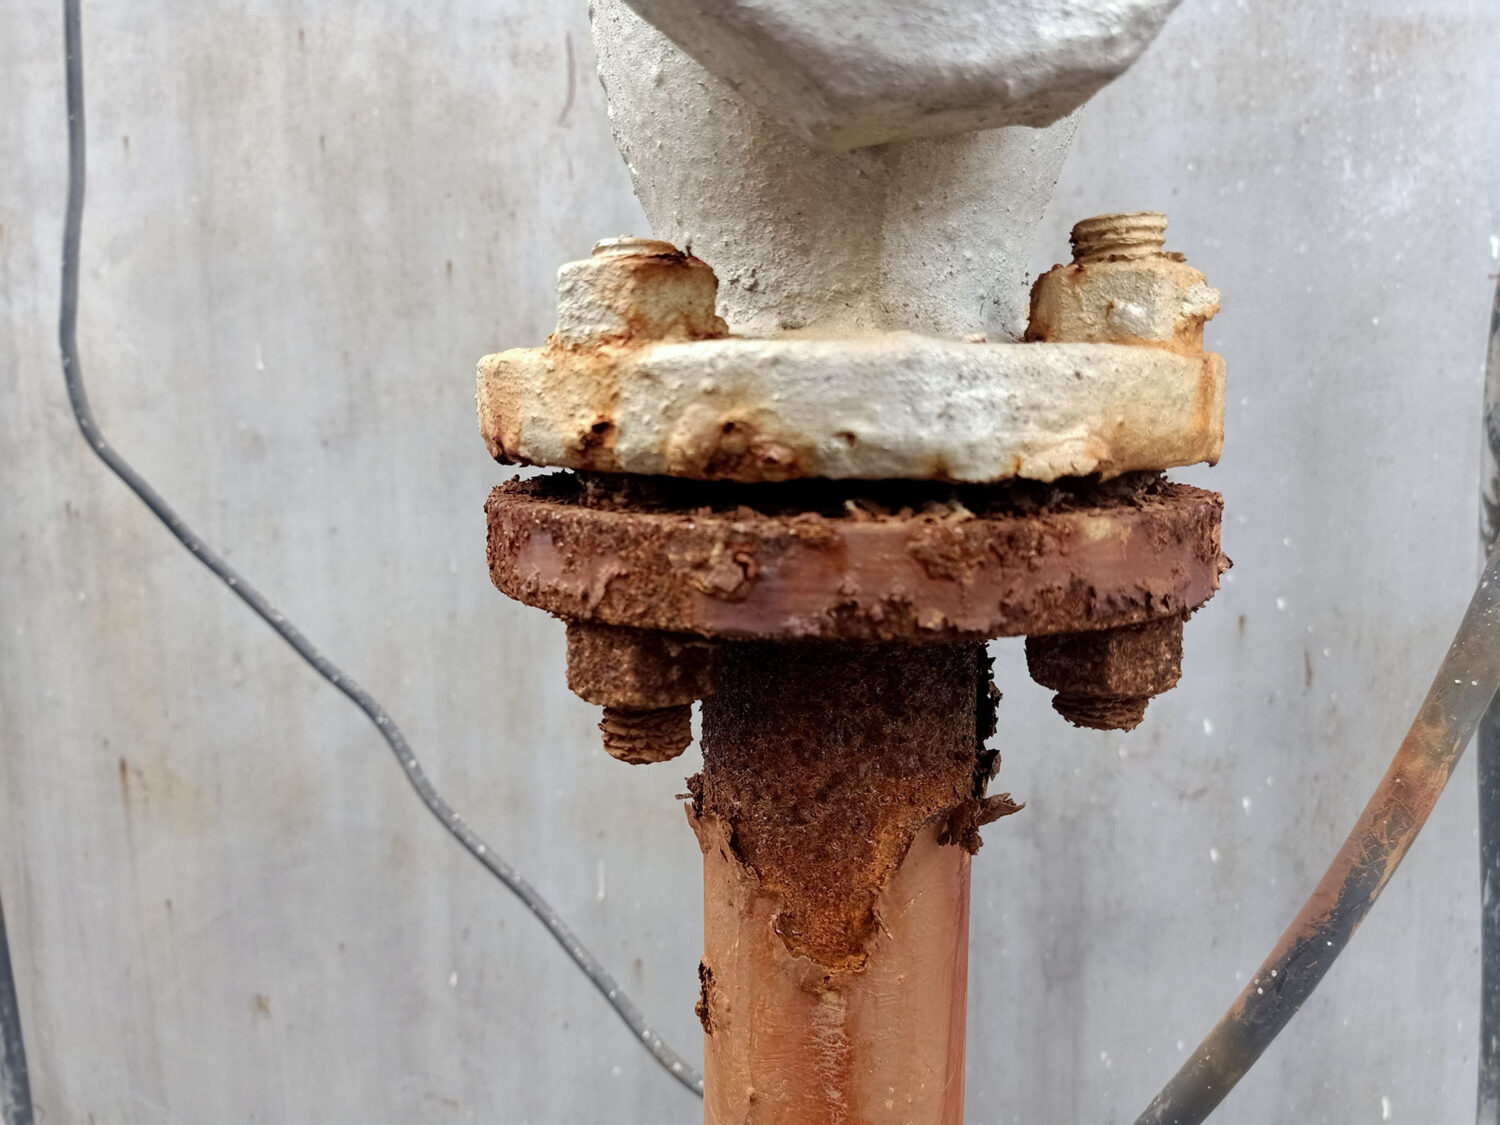
Unlike many other industries, the fluids produced in the oil and gas sector are not inert. Every barrel of oil or cubic foot of gas contains a cocktail of H2S, CO2, chlorides, water, dissolved oxygen, and organic acids. These actively attack carbon steel infrastructure including pipelines and vessels, potentially leading to corrosion that costs the industry billions every year. Whether these failures lead to environmental incidents, regulatory fines, and/or unplanned downtime, the costs can be devastating to operators.
This is what makes chemical analysis such an important intelligence layer for operators in the oil and gas sector. It provides crucial insights that make corrosion control decisions defensible, because without a clear idea of what kinds of chemicals are floating around in the infrastructure, inhibitor selection, dosing rates, and material choices are left up to guesswork.
As an integrated corrosion control partner, SMARTCORR® designs systems that begin with accurate chemical characterization of the process stream. Everything we provide — from our Sample Quill samplers rated to 10,000 psi/600 degrees Fahrenheit to our chemical injection skids to our SCEMS software platform — depends on effective chemical analysis to achieve the best results for our customers. Read on to learn about what makes chemical analysis so important to the oil and gas sector and how it typically works.
What Chemical Analysis Means in an Oil & Gas Context
In the oil and gas industry, what is known as chemical analysis is the process of systematically identifying and quantifying chemical species such as ions, dissolved gases, organic compounds, and solids in a process fluid sample. This is done to enable informed engineering and operational decision-making. Within that definition, there are distinctions to be made between qualitative chemical analysis and quantitative analysis. The former in concerned with determining the presence or absence of a corrosive species, whereas the latter is focused on determining the concentration of those species. Quantitative data is what drives decisions concerning dosing.
In the oil and gas industry, obtaining the process fluid sample often is the first challenge. Sampling complexity is created by high-pressure, high-temperature streams, as well as other concerns such as multiphase mixtures, H2S toxicity, and remote field locations. SMARTCORR® offers a sample quill system that is purpose-built for representative sampling from live, high-pressure process streams such as these. The system is designed with SS and CRA materials, rated to 10,000 psi and 600 degrees Fahrenheit, and compliant with standards such as ASME B31.3 and NACE MR0175.
Key Analytical Methods Used in Oil & Gas Chemical Analysis
Some of the primary analytical techniques used in chemical analysis for the oil and gas sector to address corrosion include:
- Titration: Measuring for alkalinity, acidity, and water content, this low-cost, field-deployable process is a good fit for routine produced-water monitoring.
- Ion Chromatography: This method typically is used for chloride, sulfate, bicarbonate, nitrate quantification in produced water, which is critical for scaling tendency and microbiologically influenced corrosion (MIC) assessment.
- ICP-OES/ICP-MS: This checks for dissolved metal ions such as iron, manganese, barium, and strontium that may indicate active corrosion or scale formation.
- Gas Chromatography: Gas composition analysis — including methane, ethane, CO2, H2S, H2 — is essential for pipeline tariff compliance, gas quality, and corrosion threat ranking.
- Spectrophotometry/Colorimetric methods: These field-applicable tests for H2S, residual corrosion inhibitor concentration in produced water and used to verify chemical injection performance in real time.
- Total Dissolved Solids (TDS)/Conductivity: This is a fast proxy for testing ionic loading and brine aggressiveness.
Which method operators select typically is determined by the type of decision it is meant to support. For example, a corrosion engineer needing to choose an inhibitor type is likely to choose an ICP process for speciation data. On the other hand, an engineer who needs to verify dosing performance would be better served by colorimetric methods to measure residual inhibitors.
SMARTCORR®'s SCEMS software integrates chemical sampling data alongside ER probe readings, coupon data, and UT measurements. This means analytical results from the field feed directly into corrosion rate prediction and CO2/H2S corrosion modules, rather than remaining confined to a spreadsheet.
Produced Fluid Chemistry Shifts — Why Continuous Monitoring Matters
Continuous monitoring is crucial because produced fluid chemistry is not static. For example, a produced water cut increase from 20% to 60% can elevate the electrochemical corrosion rate on carbon steel. The introduction of H2S above threshold concentrations can trigger sulfide stress cracking risk in high-strength steels. With chemical analysis data through the SCEMS platform, operators can flag statistical deviations in trending corrosion rate data that can prompt a fluid sample pull. This closes the loop between real-time monitoring and analytical response.
Sampling Protocols and QA/QC — Getting the Data Right in the Field
Here is a typical sampling protocol for high-pressure production lines:
- Select an appropriate sample point location (avoid dead legs, ensure flow representation).
- Install a compliant sample quill that extends into the center of the pipe flow profile.
- Purge the sample line before collection to eliminate stagnant fluid.
- Use closed-loop or pressurized collection containers to prevent dissolved gas (H2S, CO2) flash-off.
- Preserve samples immediately: acidification for metals analysis, N2 blanket for oxygen-sensitive samples, refrigeration for biological samples.
- Complete chain-of-custody documentation for LIMS entry.
- Flag the most consequential error: allowing H2S or CO2 to volatilize from the sample before pH and dissolved gas measurement, which produces artificially low acidity and underestimates corrosion threat.
- Discuss field vs. laboratory analysis trade-offs: portable colorimetric test kits and portable GC units offer immediate results for operational decisions; laboratory ICP-MS and IC offer higher precision and lower detection limits for inhibitor selection and regulatory reporting. Best practice uses both.
Sample quill systems from SMARTCORR® are constructed from SS and CRA alloys, which means the sample hardware itself does not introduce contamination or material incompatibility with sour service streams. With LIMS API integration, field sample metadata can be exported directly into the laboratory and corrosion management record with no risk of data quality loss.
Interpreting Chemical Analysis Data — From Numbers to Engineering Decisions
Singular data points are rarely sufficient. Corrosion management generally requires trend analysis over multiple sampling intervals to reveal if the fluid chemistry is stable, getting worse, or responding to treatment. Here are some of the key data points typical for a produced water analytical report:
- pH Value: Values below 6.0 in produced water indicate active acid corrosion.
- CO2 Partial Pressure: This is the primary driver of sweet corrosion rates.
- H2S Content: This can trigger material specification reviews and influence sour-service inhibitor selection.
- Chloride Concentration: Elevated chloride levels can accelerate pitting under a breakdown in inhibitor film.
- Iron Ion Concentration: The presence of dissolved iron in produced water is a direct corrosion product indicator.
- Bacterial Counts: If sulfate-reducing bacteria are present alongside sulfate in produced water, it means H2S generation is biogenic rather than geological, which changes the treatment approach and inhibitor chemistry required.
SCEMS can integrated chemical sampling data with ER probe, LPR, coupon, and UT measurement streams. This enables corrosion engineers to correlate fluid chemistry events with corrosion rate spikes in real-time, creating a continuous, integrated picture of pipeline integrity.
Building Chemical Analysis into Your Corrosion Management Program
Sampling frequency is determined by numerous factors. For example, API RP 45 and NACE SP0775 recommend minimum quarterly sampling for produced water in corrosion management programs. For assets with known active corrosion, sampling should be monthly or continuous. Sampling also is recommended any time there is an operational upset, chemical treatment change, or corrosion monitoring anomaly.
SMARTCORR® offers a pathway that enables operators to prevent gaps in analysis and ensure stronger corrosion management programs. Sample quill systems installed at representative sample points and chemical injection skids are integrated into the SCEMS software platform, and our PROSERVE technical support team is ready to help with data interpretation, program optimization, and regulatory documentation. To learn more, reach out and speak with a member of our team today.